CMU 15-112: Fundamentals of Programming and Computer Science
Class Notes: Graphics in Tkinter
Note: We will only run graphics in Standard Python. These examples will not run in Brython.
The standard Python documentation for tkinter can be hard to read. You can find our preferred documentation here.
- Create an Empty Canvas
- Draw a Rectangle
- Draw Multiple Rectangles
- Draw Centered Rectangles
- Draw Custom Colors
- Draw Other Shapes and Text
- Tuples and List-of-Tuples as Parameters
- Graphics Helper Functions
- Drawing Circular Patterns with Trigonometry
- Example: Clocks!
- Create an Empty Canvas
from tkinter import * def draw(canvas, width, height): pass # replace with your drawing code! def runDrawing(width=300, height=300): root = Tk() root.resizable(width=False, height=False) # prevents resizing window canvas = Canvas(root, width=width, height=height) canvas.configure(bd=0, highlightthickness=0) canvas.pack() draw(canvas, width, height) root.mainloop() print("bye!") runDrawing(400, 200)Result:
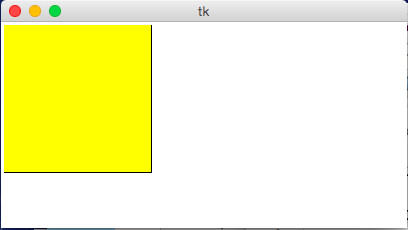
- Draw a Rectangle
def draw(canvas, width, height): canvas.create_rectangle(0,0,150,150, fill="yellow")Result:
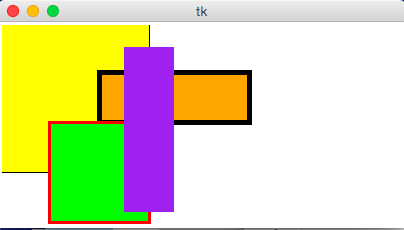
- Draw Multiple Rectangles
def draw(canvas, width, height): canvas.create_rectangle( 0, 0, 150, 150, fill="yellow") canvas.create_rectangle(100, 50, 250, 100, fill="orange", width=5) canvas.create_rectangle( 50, 100, 150, 200, fill="green", outline="red", width=3) canvas.create_rectangle(125, 25, 175, 190, fill="purple", width=0)Result:
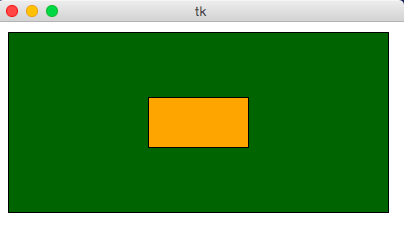
- Draw Centered Rectangles
def draw(canvas, width, height): margin = 10 # Approach #1: Add margin to top/left, subtract margin from bottom/right: canvas.create_rectangle(margin, margin, width-margin, height-margin, fill="darkGreen") # Approach #2: add/subtract width/height from center (cx, cy) (cx, cy) = (width/2, height/2) (rectWidth, rectHeight) = (width/4, height/4) canvas.create_rectangle(cx - rectWidth/2, cy - rectHeight/2, cx + rectWidth/2, cy + rectHeight/2, fill="orange")Result:
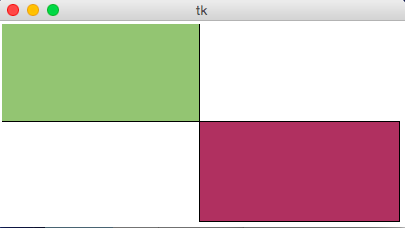
- Draw Custom Colors
def rgbString(red, green, blue): return "#%02x%02x%02x" % (red, green, blue) def draw(canvas, width, height): pistachio = rgbString(147, 197, 114) maroon = rgbString(176, 48, 96) canvas.create_rectangle(0, 0, width/2, height/2, fill=pistachio) canvas.create_rectangle(width/2, height/2, width, height, fill=maroon)Result:
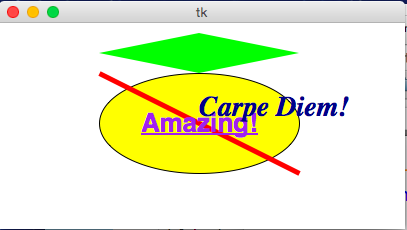
- Draw Other Shapes and Text
def draw(canvas, width, height): canvas.create_oval(100, 50, 300, 150, fill="yellow") canvas.create_polygon(100,30,200,50,300,30,200,10, fill="green") canvas.create_line(100, 50, 300, 150, fill="red", width=5) canvas.create_text(200, 100, text="Amazing!", fill="purple", font="Helvetica 26 bold underline") canvas.create_text(200, 100, text="Carpe Diem!", anchor=SW, fill="darkBlue", font="Times 28 bold italic")Result:
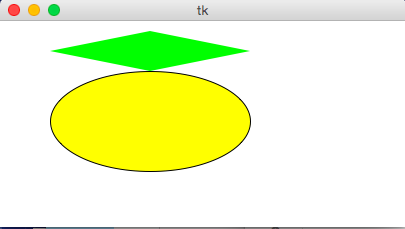
- Tuples and List-of-Tuples as Parameters
def draw(canvas, width, height): canvas.create_oval((50, 50), (250, 150), fill="yellow") canvas.create_polygon([(50,30),(150,50),(250,30),(150,10)], fill="green")Result:
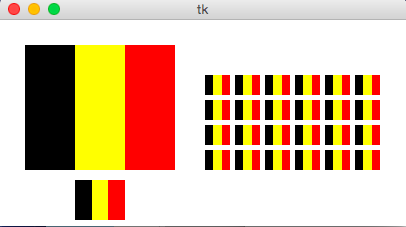
- Graphics Helper Functions
def drawBelgianFlag(canvas, x0, y0, x1, y1): # draw a Belgian flag in the area bounded by (x0,y0) in # the top-left and (x1,y1) in the bottom-right width = (x1 - x0) canvas.create_rectangle(x0, y0, x0+width/3, y1, fill="black", width=0) canvas.create_rectangle(x0+width/3, y0, x0+width*2/3, y1, fill="yellow", width=0) canvas.create_rectangle(x0+width*2/3, y0, x1, y1, fill="red", width=0) def draw(canvas, width, height): # Draw a large Belgian flag drawBelgianFlag(canvas, 25, 25, 175, 150) # And draw a smaller one below it drawBelgianFlag(canvas, 75, 160, 125, 200) # Now let's have some fun and draw a whole grid of Belgian flags! flagWidth = 30 flagHeight = 25 margin = 5 for row in range(4): for col in range(6): left = 200 + col * flagWidth + margin top = 50 + row * flagHeight + margin right = left + flagWidth - margin bottom = top + flagHeight - margin drawBelgianFlag(canvas, left, top, right, bottom)Result:
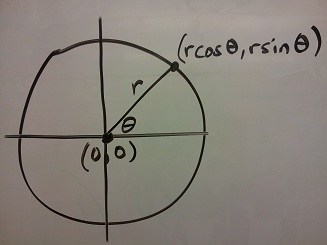
- Drawing Circular Patterns with Trigonometry
Trig 101
- Circle centered at origin
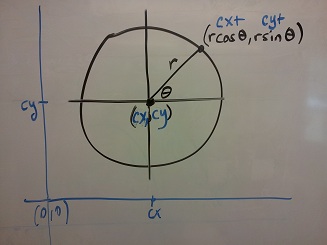
- Circle centered at (cx, cy)
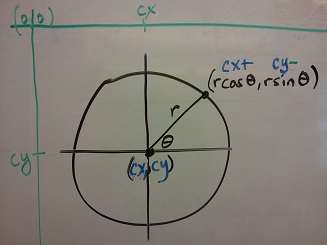
- Circle centered at (cx, cy) in Python graphics ("up is down!")
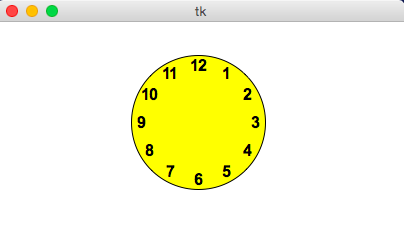
Example:import math def draw(canvas, width, height): (cx, cy, r) = (width/2, height/2, min(width, height)/3) canvas.create_oval(cx-r, cy-r, cx+r, cy+r, fill="yellow") r *= 0.85 # make smaller so time labels lie inside clock face for hour in range(12): hourAngle = math.pi/2 - (2*math.pi)*(hour/12) hourX = cx + r * math.cos(hourAngle) hourY = cy - r * math.sin(hourAngle) label = str(hour if (hour > 0) else 12) canvas.create_text(hourX, hourY, text=label, font="Arial 16 bold")Result:
- Circle centered at origin
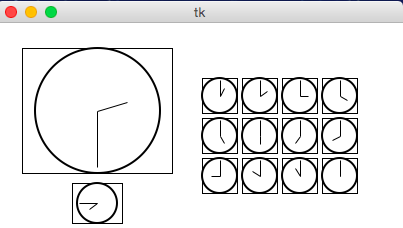
- Example: Clocks!
import math def drawClock(canvas, x0, y0, x1, y1, hour, minute): # draw a clock in the area bounded by (x0,y0) in # the top-left and (x1,y1) in the bottom-right # with the given time # draw an outline rectangle canvas.create_rectangle(x0, y0, x1, y1, outline="black", width=1) # find relevant values for positioning clock width = (x1 - x0) height = (y1 - y0) r = min(width, height)/2 cx = (x0 + x1)/2 cy = (y0 + y1)/2 # draw the clock face canvas.create_oval(cx-r, cy-r, cx+r, cy+r, outline="black", width=2) # adjust the hour to take the minutes into account hour += minute/60.0 # find the hourAngle and draw the hour hand # but we must adjust because 0 is vertical and # it proceeds clockwise, not counter-clockwise! hourAngle = math.pi/2 - 2*math.pi*hour/12 hourRadius = r*1/2 hourX = cx + hourRadius * math.cos(hourAngle) hourY = cy - hourRadius * math.sin(hourAngle) canvas.create_line(cx, cy, hourX, hourY, fill="black", width=1) # repeat with the minuteAngle for the minuteHand minuteAngle = math.pi/2 - 2*math.pi*minute/60 minuteRadius = r*9/10 minuteX = cx + minuteRadius * math.cos(minuteAngle) minuteY = cy - minuteRadius * math.sin(minuteAngle) canvas.create_line(cx, cy, minuteX, minuteY, fill="black", width=1) def draw(canvas, width, height): # Draw a large clock showing 2:30 drawClock(canvas, 25, 25, 175, 150, 2, 30) # And draw a smaller one below it showing 7:45 drawClock(canvas, 75, 160, 125, 200, 7, 45) # Now let's have some fun and draw a whole grid of clocks! width = 40 height = 40 margin = 5 hour = 0 for row in range(3): for col in range(4): left = 200 + col * width + margin top = 50 + row * height + margin right = left + width - margin bottom = top + height - margin hour += 1 drawClock(canvas, left, top, right, bottom, hour, 0)Result: